Average Speed of Answer in Call Centers: What It Is and How to Improve It
In modern contact centers, customer patience is measured in seconds. The moment a caller enters a queue, expectations are set, frustration begins to build, and...

Key highlights
TL;DR: Average Speed of Answer Explained for Call Center Leaders
- The average speed of answer in call centers measures how long customers wait before speaking to a live agent after entering the queue
- Call center ASA is one of the most visible and sensitive call center KPIs, directly impacting customer satisfaction and abandonment
- A lower ASA does not always mean a better experience unless paired with resolution and call quality metrics
- Industry benchmarks often target 20–30 seconds, but “good” ASA varies by industry, urgency, and call type
- High ASA is usually a symptom of deeper operational issues like staffing gaps, routing inefficiencies, or demand spikes
- Improving ASA requires both operational discipline and smart automation, not just adding more agents
In modern contact centers, customer patience is measured in seconds. The moment a caller enters a queue, expectations are set, frustration begins to build, and every additional second influences how that interaction will end.
That is why the average speed of answer in call centers remains one of the most closely tracked performance indicators. It is simple, visible, and emotionally charged. Customers feel it immediately, and leaders see it reflected in dashboards every day.
But while ASA is easy to measure, it is often misunderstood.
Many teams focus on lowering the number without understanding what is driving it, or worse, they optimize for speed at the cost of resolution. The result is a contact center that answers calls quickly but still delivers a poor customer experience.
This guide breaks down what call center ASA actually measures, why it matters, what “good” ASA looks like, and how to think about it strategically rather than tactically.
What is the Average Speed of Answer (ASA)?
Average speed of answer in call centers refers to the average time a caller waits in the queue before a live agent answers. It is one of the clearest indicators of how quickly a contact center responds once a customer is actively waiting for help.
It starts counting only after the caller enters the queue. Time spent navigating IVR menus, listening to announcements, or selecting options is usually not included. In simple terms, ASA answers one question: how long does it take for a customer to reach a human once they are waiting?
Because it is simple to calculate and easy to track, ASA is widely used as a core call center KPI. But while the number is easy to understand, its meaning becomes more useful when viewed alongside the operational context behind it.
The ASA formula explained
The standard formula for call center ASA is:
Total wait time for answered calls ÷ Total number of answered calls
Example:
- Total wait time across all answered calls: 10,000 seconds
- Total answered calls: 400
Average Speed of Answer = 25 seconds
This simplicity is why ASA is widely used as a core call center KPI. But it is also why it can be misleading when viewed in isolation.
Average Speed of Answer vs Average Wait Time
These two terms are often used as if they mean the same thing, but they are not always measured the same way. Understanding the difference helps teams avoid drawing the wrong conclusions from surface-level numbers.
The average speed of answer typically measures wait time only for calls that were answered. Average wait time in call centers may include abandoned calls (opens in a new tab), depending on how the metric is calculated. That difference matters because a center can appear healthy on paper while customers are still hanging up before reaching an agent.
This is why experienced operators never rely on ASA alone. A strong number means very little if abandonment is rising or if customers are dropping before support is reached.
Why ASA is a Critical Call Center KPI
Long wait times signal one thing to customers: their time is not valued.
Even when an issue is eventually resolved, excessive waiting erodes trust and increases the likelihood of complaints, negative reviews, and churn. Customers may forgive a slow resolution, but they rarely forgive being ignored.
Furthermore, speed is now the primary currency of trust. In the Salesforce State of the Connected Customer (opens in a new tab), 64% of consumers say their definition of a 'timely interaction' is an instant, real-time response. When ASA creeps up, you are directly violating the expectation of 2/3 of your audience."
This is why call center ASA is closely tied to CSAT and NPS scores.
Connection to SLAs and business commitments
Many organizations define service-level agreements around answer times, such as answering 80 percent of calls within 20 seconds.
Failing to meet these SLAs can result in:
- Financial penalties
- Loss of contracts
- Damage to brand reputation
In regulated or enterprise environments, ASA is not just an operational metric. It is a contractual obligation.
Influence on agent performance and morale
High ASA often means agents are under constant pressure, juggling overflowing queues and frustrated callers. This leads to:
- Burnout and higher attrition
- Rushed conversations
- Lower resolution quality
Ironically, trying to force agents to answer faster without addressing root causes often makes performance worse, not better.
What is a Good Average Speed of Answer?
There is no single perfect ASA target for every business. What is considered good depends on industry, customer expectations, and the urgency of the interaction.
Benchmarks can help establish a starting point, but they should not be treated as fixed rules. A short delay may be acceptable for a low-priority billing question, while even a brief wait may feel unacceptable for fraud, healthcare, or urgent service issues.
The goal is not to chase the lowest possible number. It is to align answer speed with the type of support being delivered and the expectations customers bring to that moment.
Typical industry benchmarks for ASA
| Industry | Common ASA Range |
|---|---|
| Retail | 20-30 seconds |
| Healthcare | 30-60 seconds |
| Banking and Financial Services | 20-40 seconds |
| Telecommunications | 30-45 seconds |
| Travel and Hospitality | 15-30 seconds |
| Technical Support | 30-60 seconds |
These numbers provide guidance, not rules.
For example, a 45-second wait for a billing inquiry may be acceptable, while a 30-second wait for fraud reporting may feel intolerable.
The real goal is not to chase a number, but to align answer speed with customer intent and urgency.
Why Chasing Low ASA Alone Can Backfire
Average speed of answer is an important metric, but it becomes risky when treated as the primary goal instead of a signal. Focusing only on reducing wait time can push teams toward short-term fixes that look good on dashboards but weaken the overall customer experience.
Many teams fall into the trap of treating ASA as a standalone success metric. This often leads to unintended consequences. Lowering ASA without improving routing or staffing can result in calls being answered quickly but transferred multiple times, agents handling queries they are not equipped for, and faster answers that still lead to repeat calls.
In these scenarios, improving call center efficiency becomes difficult because speed is prioritized over resolution. The operation appears faster, but the actual workload increases due to unresolved issues and repeated contacts.
ASA should be viewed as a signal, not a goal. Sustainable improvement comes from balancing speed with accuracy, routing quality, and resolution, so that answering faster also means solving the problem effectively.
How ASA Fits into the Bigger KPI Picture
To be meaningful, call center ASA must be evaluated alongside other call center KPIs, such as:
- First call resolution
- Call abandonment rate
- Average handle time
- Customer satisfaction scores
Only when these metrics are viewed together can leaders truly understand performance and identify where intervention is needed.
The Real Causes of High Average Speed of Answer
When the average speed of answer in call centers starts climbing, most teams jump to the same conclusion: “We need more agents.”
Adding agents is often a temporary fix for a structural problem. A recent McKinsey analysis on Agentic AI (opens in a new tab) found that 35% of organizations now plan to automate over 60% of inbound inquiries by 2028 to stabilize their service levels.
In reality, staffing is only one piece of the puzzle. High call center ASA is usually a symptom of deeper structural problems. Let’s break down the most common causes.
Staffing gaps and forecasting errors
Yes, understaffing increases average wait time in call centers. But most high-ASA environments are not permanently understaffed. They are misaligned.
Common issues include:
- Inaccurate call volume forecasting
- Rigid schedules that do not match demand patterns
- Overstaffing during low volume and understaffing during peaks
When forecasting models rely only on historical averages, they fail to account for:
- Seasonal spikes
- Campaign-driven surges
- Weather, outages, or external events
This results in queues forming faster than agents can absorb them.
Inefficient call routing and queue design
Even with enough agents, poor routing can cripple the call center ASA.
Examples include:
- Calls are routed by department instead of intent
- General queues feeding specialized agents
- No prioritization for urgent or high-value calls
When customers land in the wrong queue, they wait longer and often get transferred. Each transfer resets frustration (opens in a new tab), even if ASA looks acceptable on paper.
Routing inefficiency directly undermines efforts to improve call center efficiency.
Spikes in call volume and demand volatility
Call centers are rarely overwhelmed gradually. They break suddenly.
Common spike triggers:
- Billing cycles
- Policy changes
- Product launches
- Service outages
During spikes, ASA rises exponentially rather than linearly. Queues compound faster than human teams can respond.
Without elastic capacity, average speed of answer in call centers becomes unpredictable and unmanageable.
Long Average Handle Time (AHT)
ASA and AHT are tightly linked.
When handle times increase:
- Agents stay occupied longer
- Queue throughput slows
- New calls pile up
Causes of long AHT include:
- Agents searching for information
- Repeating verification steps
- Handling routine questions manually
Lowering AHT responsibly is one of the most effective ways to reduce average wait time in call centers (opens in a new tab) without sacrificing quality.
How to Reduce ASA the Right Way
Reducing ASA the right way starts with understanding that wait time is usually the result of broader operational conditions, not just slow answering. When queues are overloaded with avoidable demand, routing is inconsistent, or staffing does not match call patterns, ASA rises quickly. That is why the goal is not simply to move faster, but to create a system that handles demand more smoothly from the start.
Reducing ASA is not just about answering faster. It is about improving flow, reducing avoidable pressure, and creating a more stable operation overall. The most effective strategies combine better planning, smarter routing, demand reduction, and flexible support models. When these work together, ASA improves as a result of stronger operations rather than reactive firefighting.
That is the difference between short-term recovery and lasting performance improvement. When the system is designed well, lower ASA becomes a natural outcome of better operations, not a number teams are constantly struggling to control.
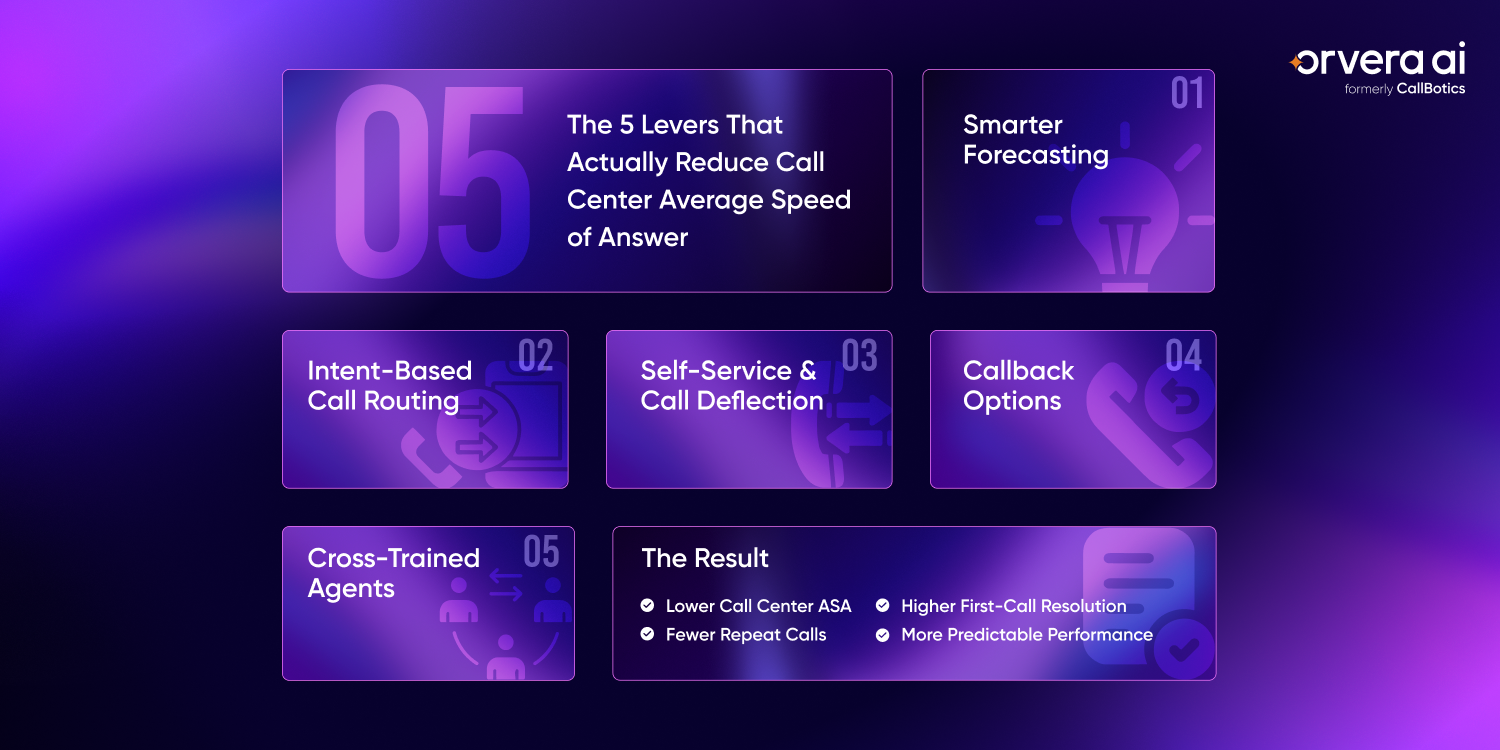
Workforce management and smarter forecasting
Modern workforce management goes beyond static schedules.
High-performing centers:
- Forecast at 15- or 30-minute intervals
- Adjust staffing dynamically during spikes
- Use intraday reforecasting
This prevents queues from forming before corrective action is taken.
Intelligent call routing based on intent
Intent-based routing significantly lowers call center ASA by ensuring:
- Calls reach the right agent on the first attempt
- Transfers are minimized
- Resolution happens faster
Routing should consider:
- Call reason
- Customer history
- Urgency level
This alone can reduce wait times without adding headcount.
Self-service and call deflection
Not every call needs an agent.
High-volume, repetitive inquiries are the biggest contributors to rising ASA. Examples include:
- Appointment confirmations
- Order status checks
- Balance inquiries
By deflecting these calls through IVR, chat, or voice automation, teams free up agents to handle complex interactions.
This directly improves ASA by reducing queue volume.
Callback options to control perceived wait time
Callback technology does not eliminate waiting, but it changes how waiting feels.
Benefits include:
- Lower abandonment rates
- Reduced peak-time congestion
- Improved customer satisfaction
From a metrics perspective, callbacks help stabilize average wait time in call centers during surges.
Cross-training agents to increase flexibility
Rigid skill silos limit responsiveness.
Cross-trained agents:
- Absorb overflow from other queues
- Reduce bottlenecks
- Improve overall throughput
This flexibility is critical for maintaining consistent call center ASA during unpredictable demand.
How These Strategies Improve Call Center Efficiency
When executed together, these improvements do more than lower ASA.
They:
- Reduce repeat calls
- Improve first-call resolution
- Stabilize staffing costs
- Create predictable performance
This is what it truly means to improve call center efficiency.
Most customers actually prefer this path if it's faster; Harvard Business Review reports that 81% of all customers attempt to resolve issues themselves via self-service before ever reaching out to a live representative. High ASA is often a sign that your self-service tools are failing to meet that 81% demand.
Why Average Speed of Answer Breaks as Call Centers Scale
At smaller volumes, controlling ASA feels manageable. Teams can adjust staffing, tweak schedules, or temporarily redistribute queues to keep wait times in check. But as call volumes grow, those levers stop working the way they used to.
What was once a predictable operation becomes fragile. A billing cycle, a policy change, or a service disruption can overwhelm queues. Average wait times in call centers suddenly spike, and recovery can take hours or even days. This is not because teams are underperforming. It is because traditional call center models are not designed for volatility.
The structural limits of human-only call centers
When the call center ASA rises, the most common response is to hire more agents. In the short term, this can help. In the long term, it creates new constraints.
Hiring and training take time. Schedules remain fixed. Labor costs increase, while demand continues to fluctuate unpredictably.
As a result, ASA improves briefly, then drifts upward again.
This is why organizations that rely only on staffing changes struggle to sustainably improve call center efficiency. Human capacity scales slowly. Customer demand does not.
How call mix and call types inflate ASA
Not all calls impact the average speed of answer equally.
A small set of high-frequency, low-complexity calls often consumes a disproportionate share of queue capacity. These include confirmations, status checks, follow-ups, and simple information requests.
When these calls enter the same queues as complex issues, they slow everything down.
Even with good routing and forecasting, queues become congested, agents get overloaded, and the ASA rises for everyone.
What actually reduces ASA in practice
The most reliable way to lower call center ASA is not to answer calls faster, but to prevent unnecessary calls from entering agent queues in the first place.
When structured, repeatable conversations are resolved without human involvement:
- Queue volume drops
- Agents focus on complex issues
- ASA stabilizes instead of swinging wildly
ASA improves with better flow, not more pressure.
Explore how Orvera improves answer speed through better routing and end-to-end voice automation. (opens in a new tab)Human-Only Vs. Automation-Assisted Call Center Models
| Dimension | Human-Only Model | Automation-Assisted Model |
|---|---|---|
| Reaction to call spikes | Slows quickly | Scales instantly |
| ASA stability | Highly variable | Predictable |
| Agent workload | Reactive and congested | Focused on complex work |
| Transfers | Common | Significantly reduced |
| SLA adherence | Breaks under pressure | Maintained consistently |
This is why automation is now central to modern call center KPIs, not as a cost-cutting tactic, but as a reliability mechanism.
Most customers actually prefer this path if it's faster. A Harvard Business Review (opens in a new tab) report states that 81% of customers attempt to resolve issues themselves via self-service before ever reaching out to a live representative. High ASA is often a sign that your self-service tools are failing to meet that demand.
Why Many AI Voice Tools Fail to Improve ASA
Not all automation improves ASA in call centers because many tools do not actually reduce queue pressure. They identify intent or route calls, but if the customer still needs an agent, the queue remains unchanged, and wait times do not improve in a meaningful way.
Many AI voice tools focus on routing rather than resolution, and often struggle with real-world complexity, concurrent call loads, or changes in customer intent mid-conversation. As a result, they escalate too early or too often, pushing volume back into the queue instead of removing it.
If you’re looking to reduce ASA, automation must resolve conversations end-to-end, not simply redirect them. Real improvement comes from reducing agent dependency (opens in a new tab), handling volume reliably, and ensuring the queue only contains interactions that truly require human support.
How Orvera Fits Into the ASA Conversation
Most AI voice assistants promise automation. Orvera focuses on outcomes.
Orvera plays a dedicated role in improving average answer speed in call centers because it was designed for real contact center conditions, not ideal scenarios. It assumes high call volumes, shifting customer intent, peak traffic, and the ongoing need for clean escalation to human agents.
This makes its impact on ASA practical rather than theoretical.
What makes Orvera relevant to ASA
Orvera stands out because it:
- Resolves structured customer conversations end-to-end instead of stopping at routing
- Is ready to deploy in 3 to 6 weeks, allowing teams to respond quickly to rising ASA
- Uses real-time sentiment analysis to adjust tone and escalation paths during live conversations
- Handles inbound and outbound calls using the same conversation logic, reducing repeat volume
- Scales across concurrent calls without degrading performance
- Makes performance visible through built-in real-time analytics tied to operational outcomes
What this means for call center performance
For customers, this results in:
- Fewer transfers
- Shorter waits
- Clearer resolution
For operations teams, it means:
- More predictable call center ASA
- Lower operational complexity
- Better alignment across call center KPIs
By removing friction from routine interactions, Orvera strengthens how teams operate while preserving human judgment where it matters most.
Conclusion
Average speed of answer is an important metric, but it should never be managed in isolation. When ASA rises, it usually points to deeper issues in routing, demand management, staffing alignment, or resolution flow. Treating it as a surface-level speed problem may improve the number temporarily, but it rarely improves the operation behind it.
The most effective way to reduce ASA is to improve the system that creates it. That means lowering avoidable demand, routing customers more accurately, supporting agents with better context, and using automation where it can genuinely remove pressure from the queue. When those pieces work together, ASA becomes more stable because the operation itself becomes stronger.
Frequently asked questions
The average speed of answer in call centers measures how long a caller waits in a queue before speaking to a live agent. It is important because long wait times directly impact customer satisfaction, call abandonment, and brand perception. ASA is also a core metric used to evaluate operational health and service-level performance.